Real-Time Ops
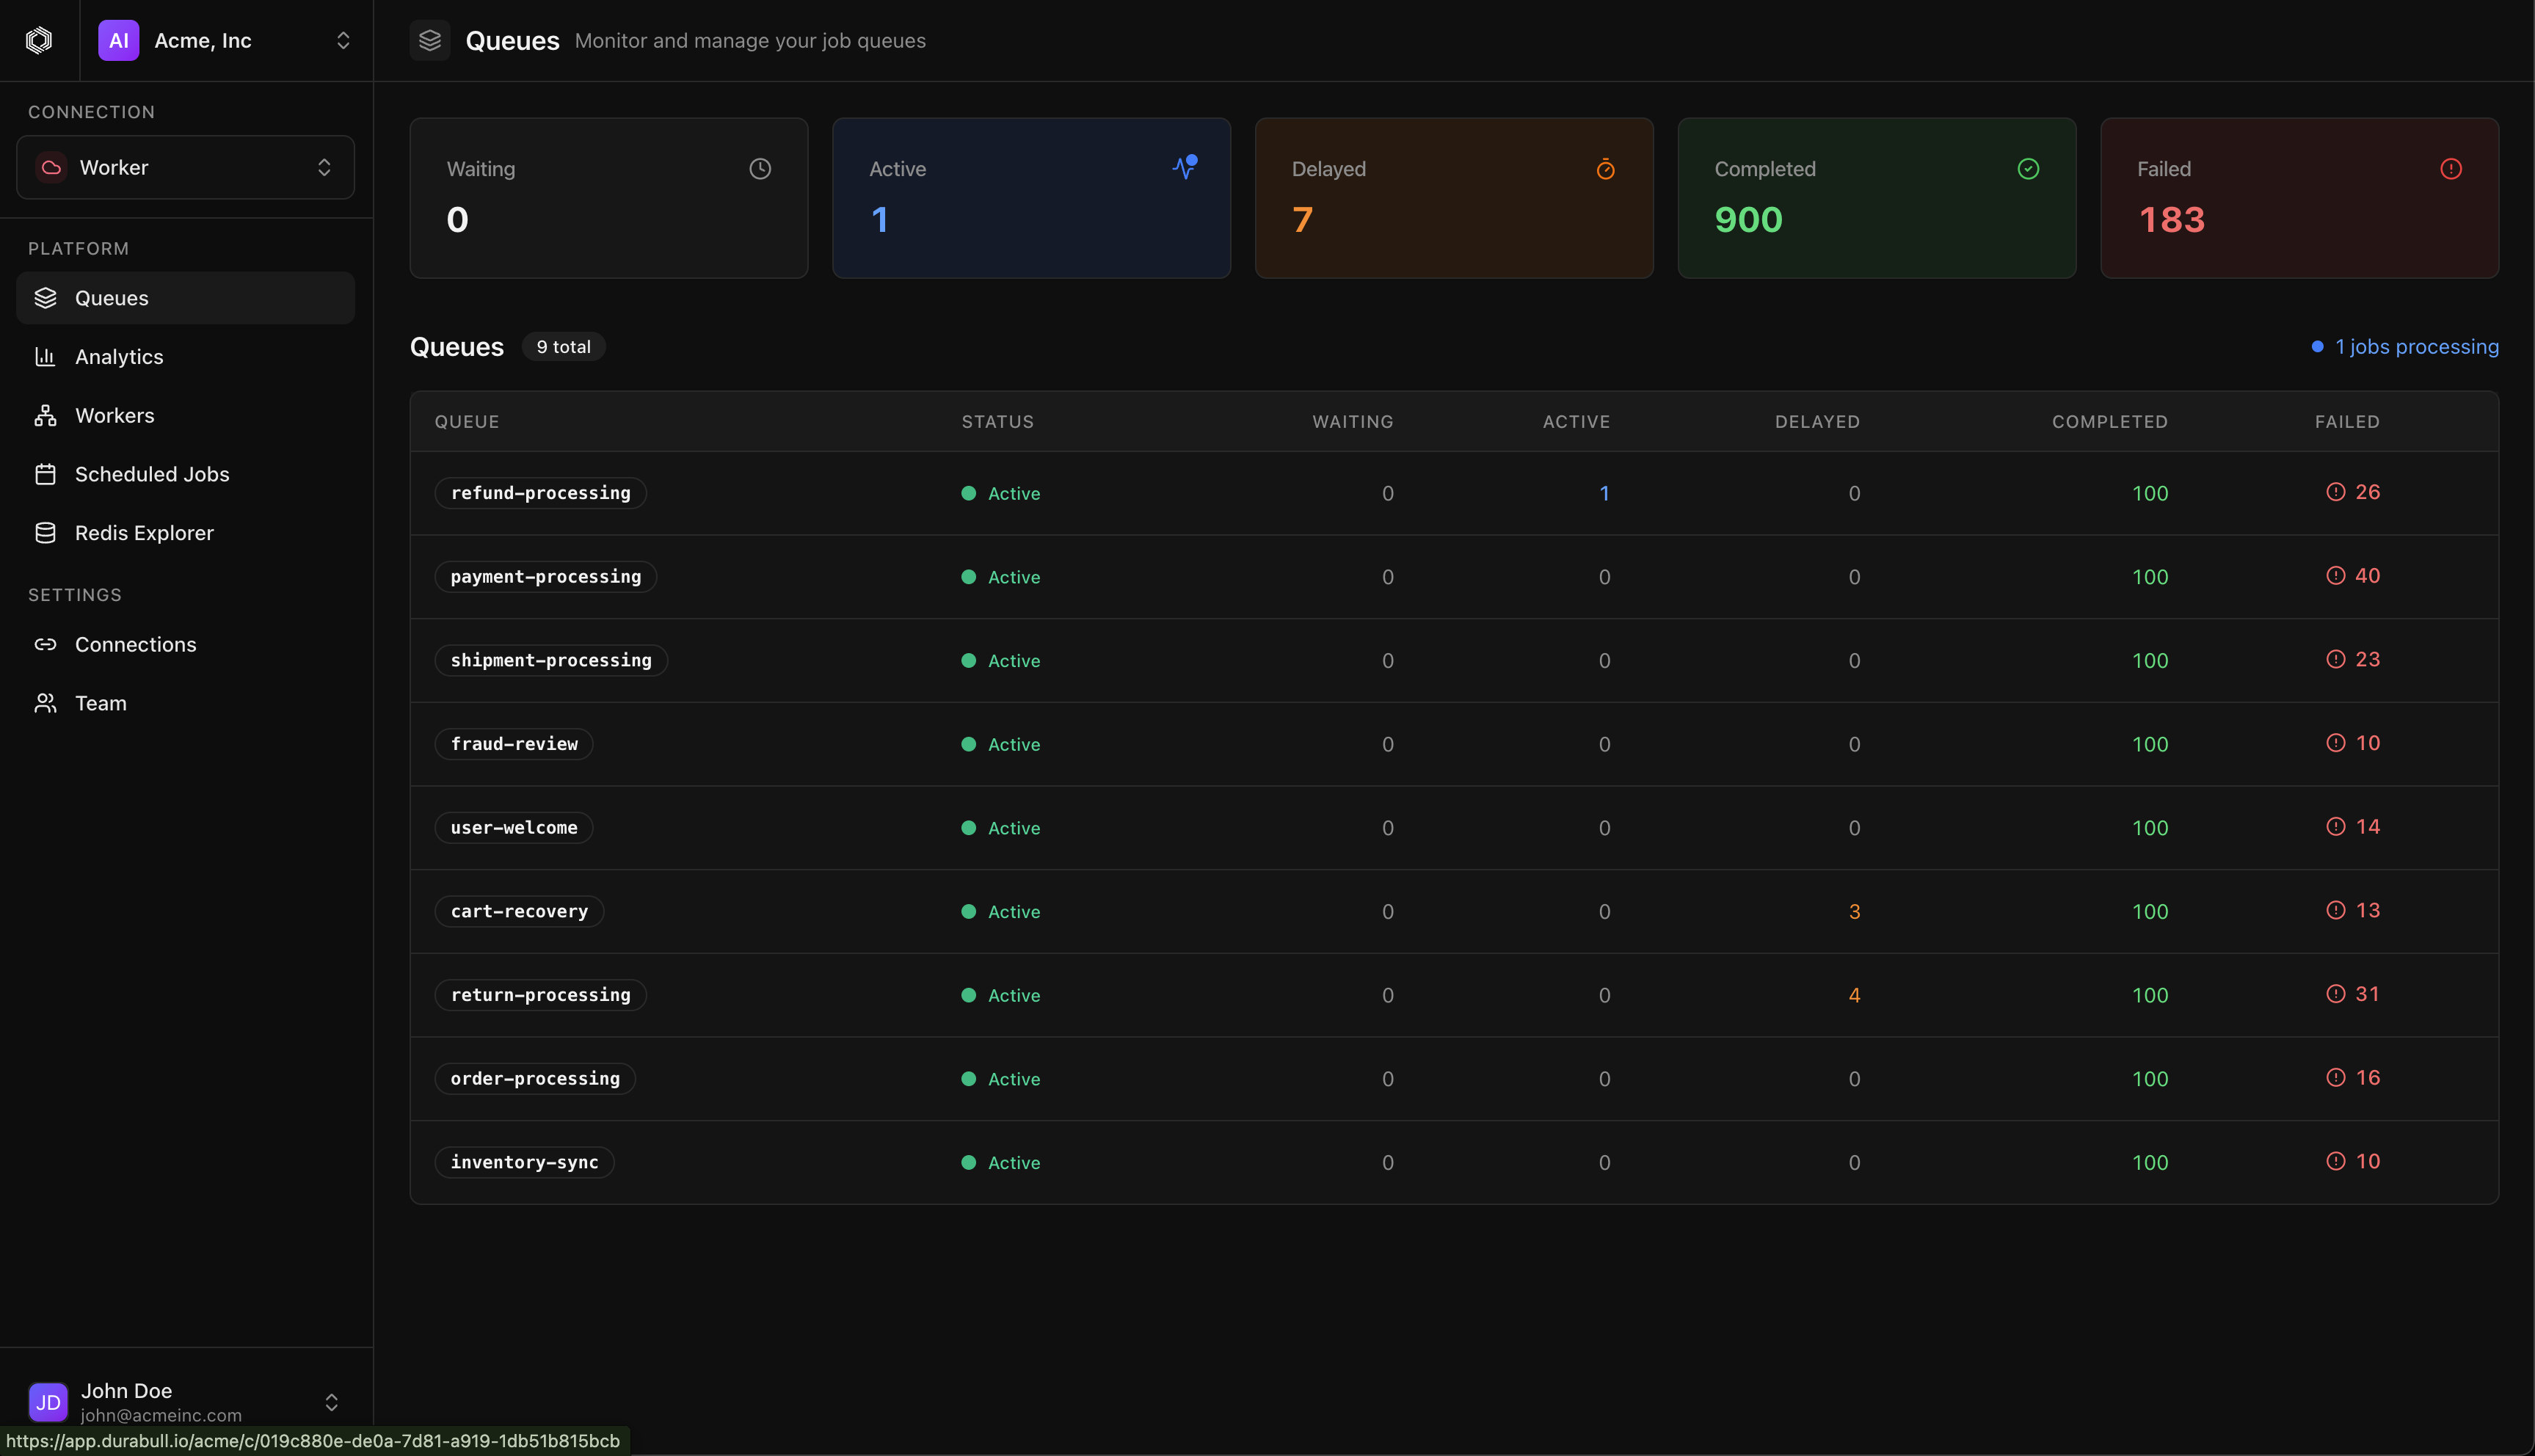
Unified Queue Command Center
Track waiting, active, delayed, completed, and failed jobs from one live surface without polling or context switching.
Durabull gives your team one clean command surface to inspect queues, recover failed jobs, and keep distributed workers healthy without digging through Redis internals.
Also available on desktop
Need the desktop build? Download the current Apple Silicon macOS release or see install options for Windows and Homebrew in thedesktop apps guide.
Download the macOS app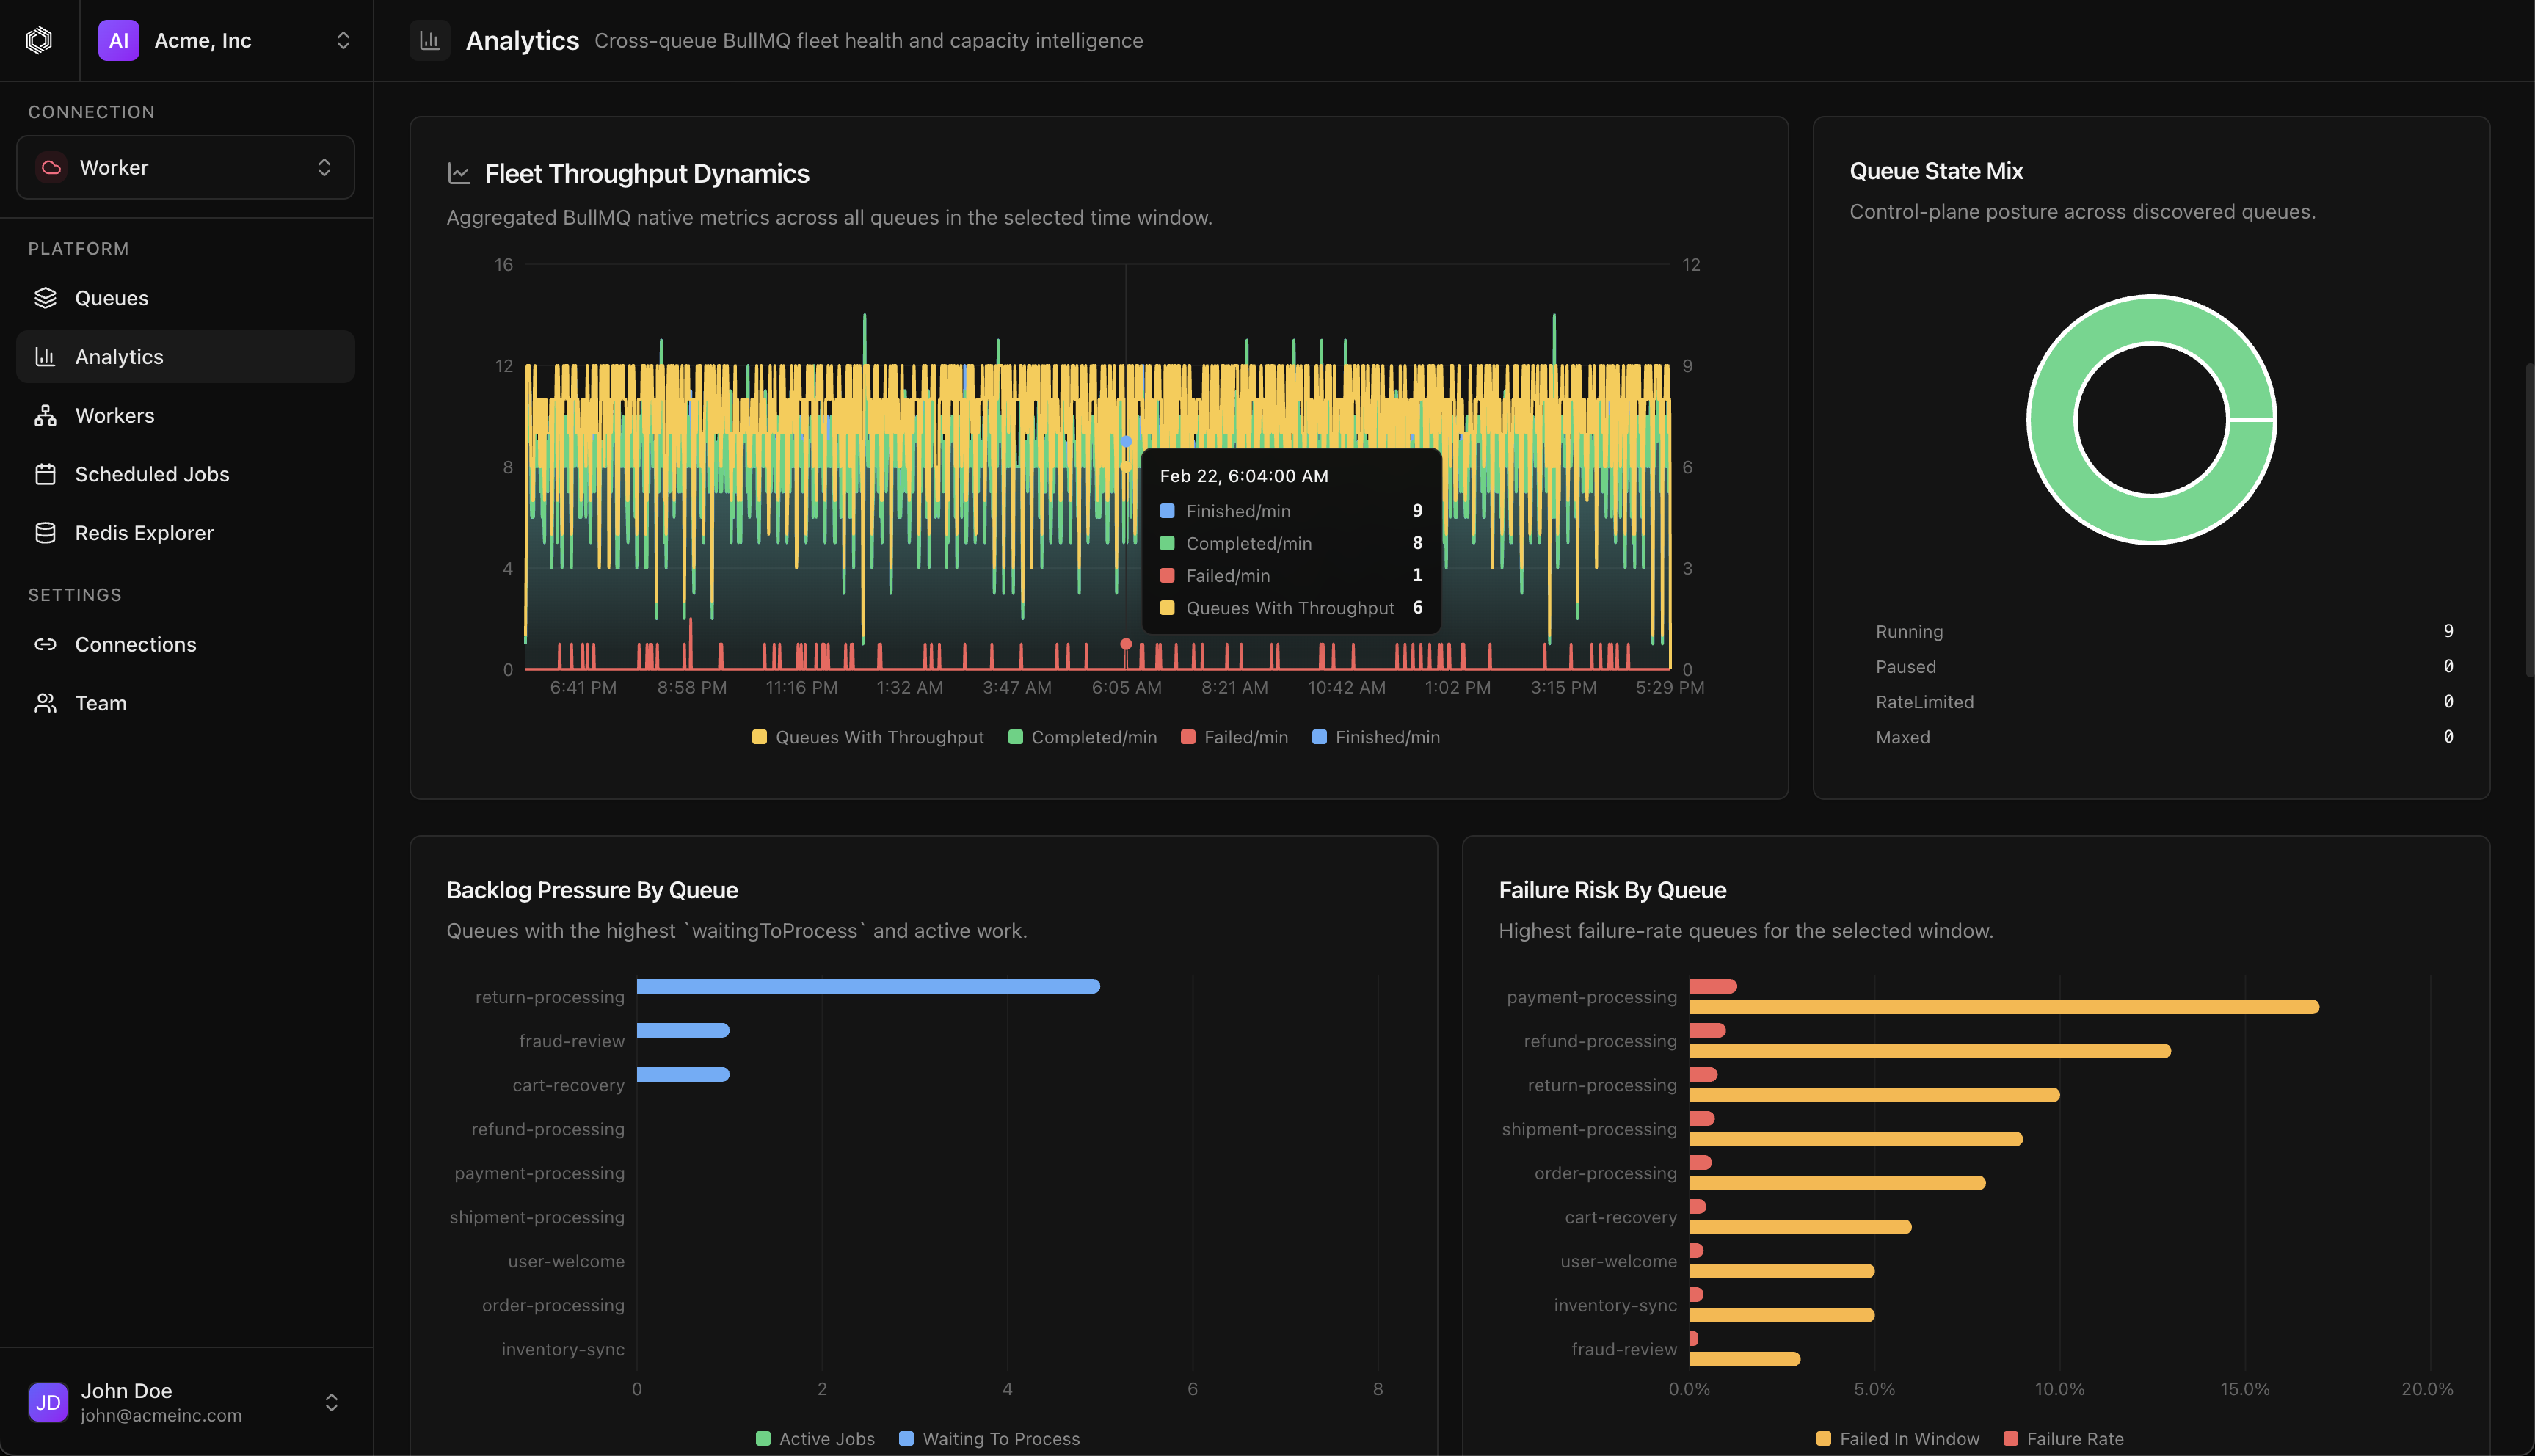
From triaging failed jobs to validating scheduled workloads, Durabull keeps every operational path visible, fast, and deeply inspectable, including fleet-wide throughput intelligence.
The tour auto-advances to showcase core surfaces.
High-signal status across every queue and connection.
Durabull is intentionally built for engineering teams that need speed during incidents and clarity during everyday queue operations.
Real-Time Ops
Track waiting, active, delayed, completed, and failed jobs from one live surface without polling or context switching.
Debugging
Inspect stack traces, attempt history, payload metadata, and retry controls in one place when incidents happen.
Scheduling
Review next runs, pause schedules safely, and understand scheduler drift before it becomes an outage.
Topology
Understand where jobs run across environments and workers so on-call decisions happen with confidence.
Data Layer
Inspect key structures and queue internals directly from the UI while keeping production troubleshooting focused.
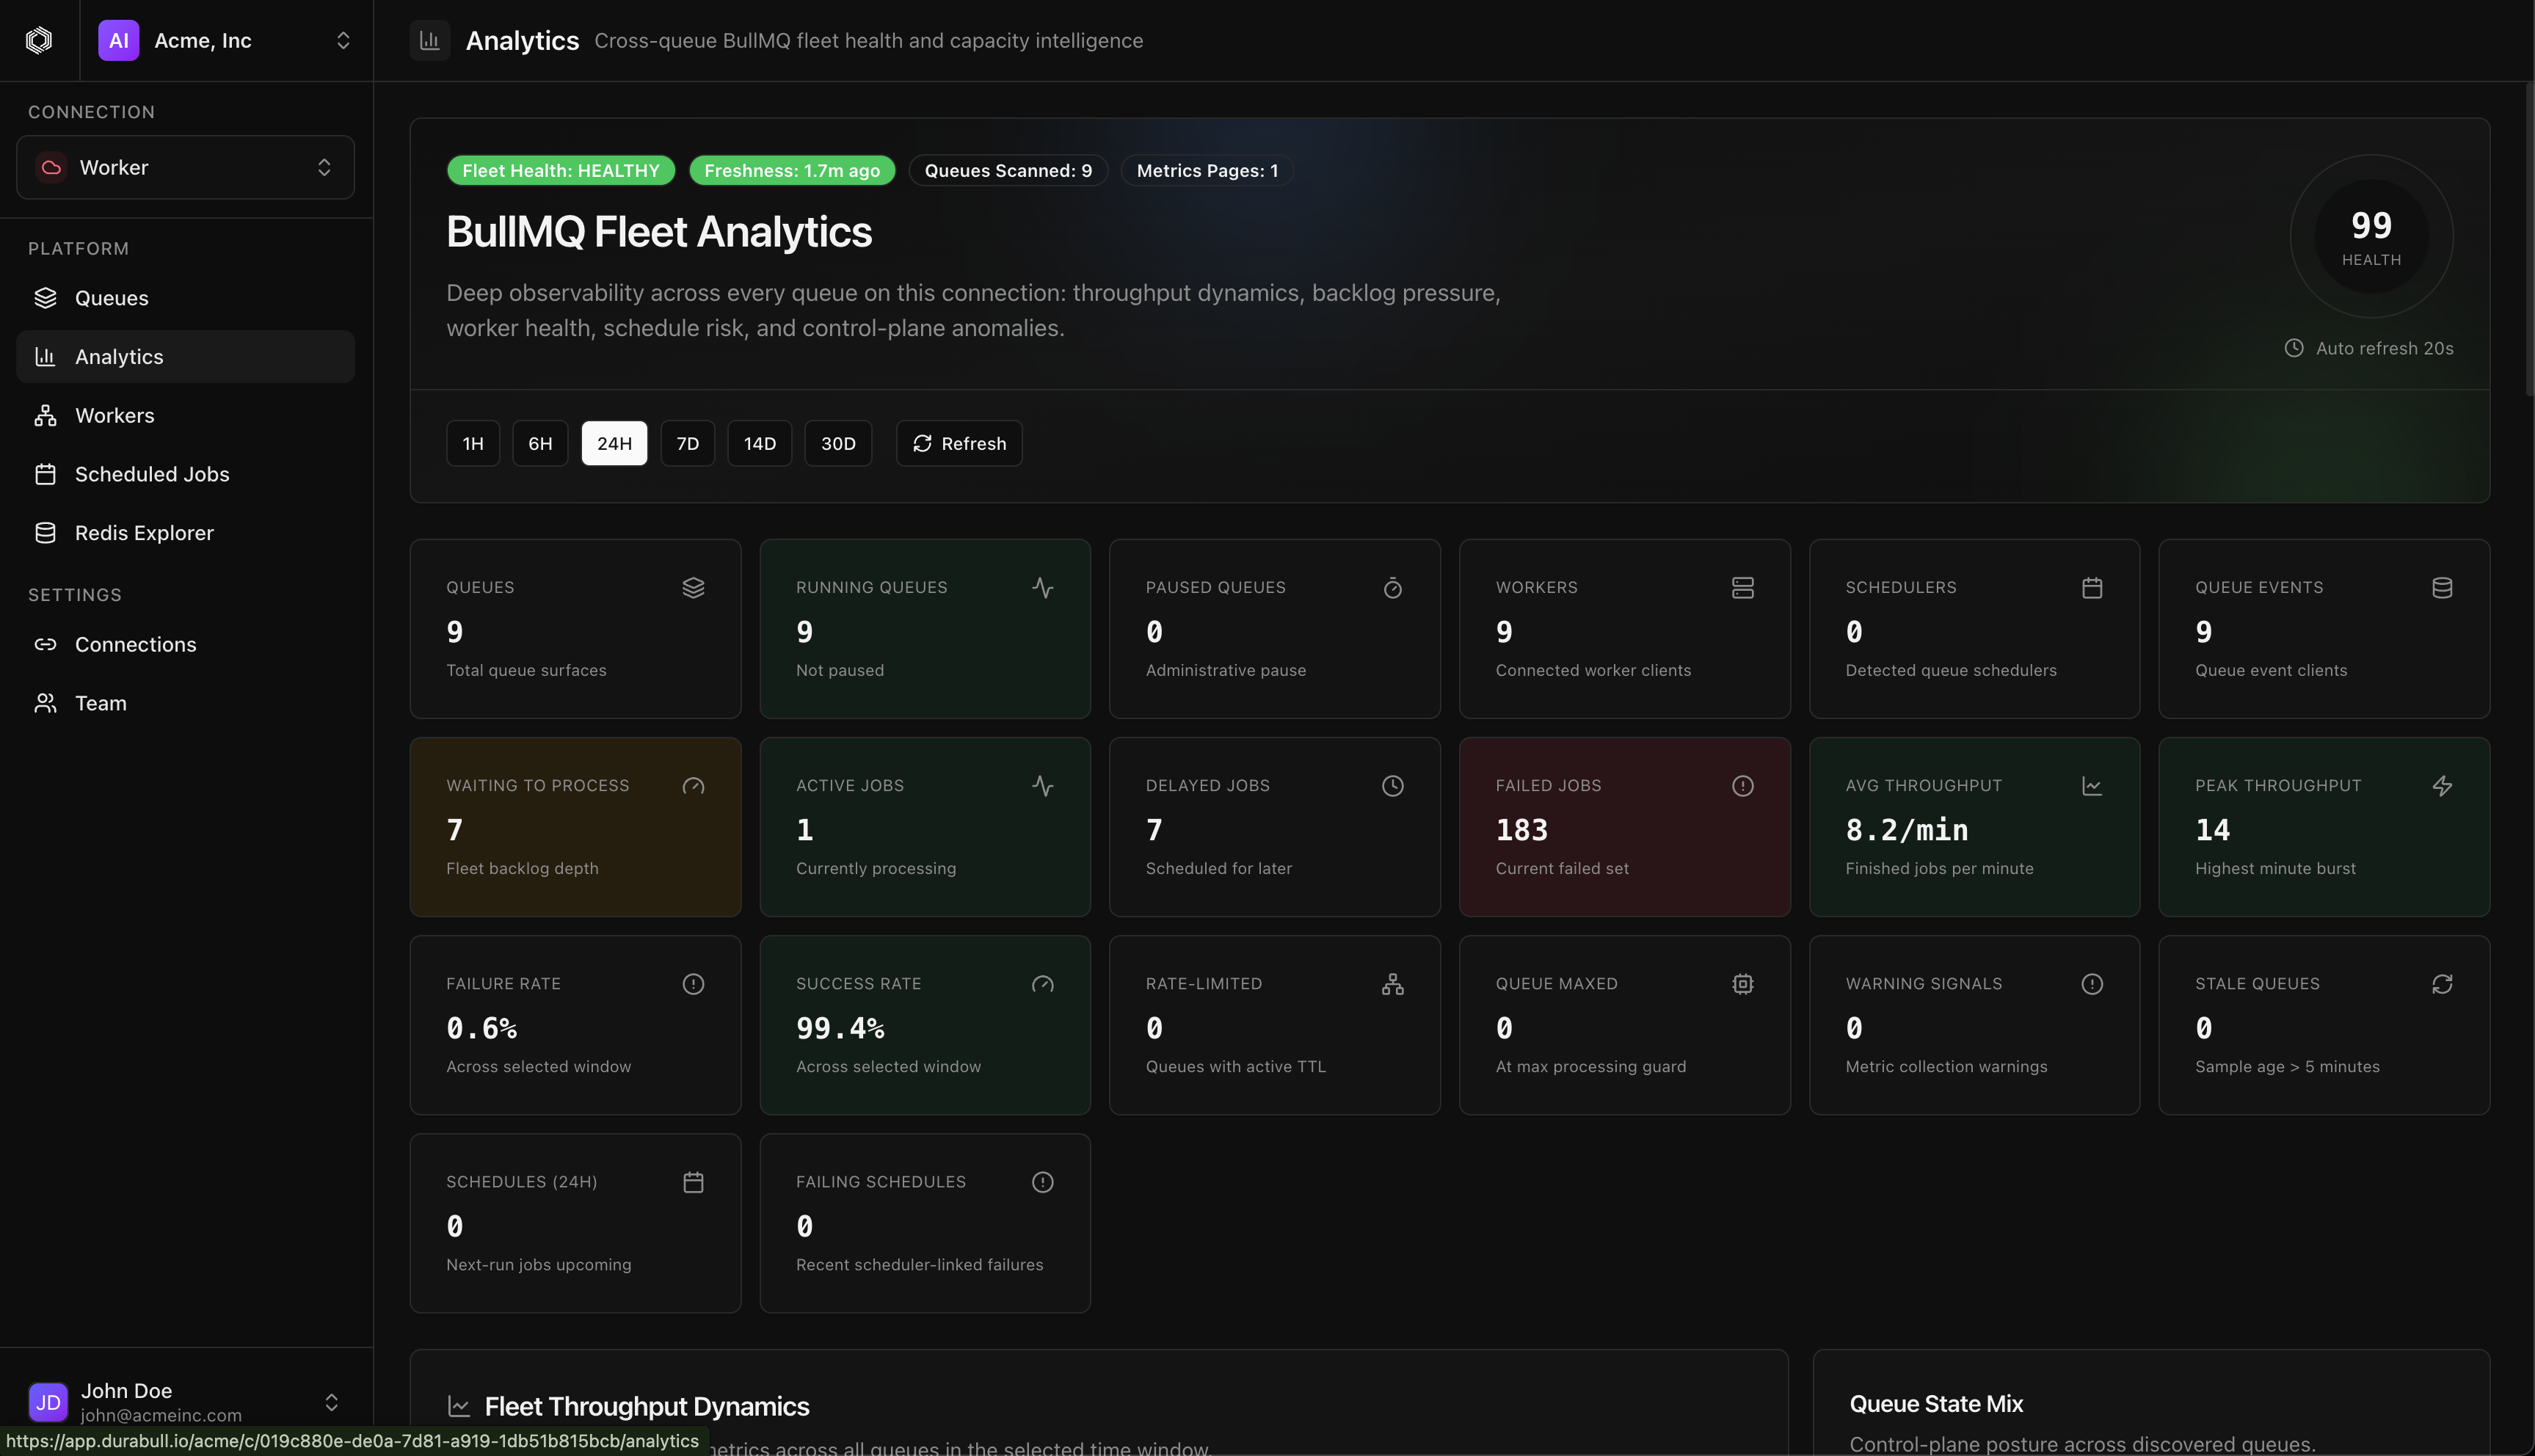
Fleet Analytics
Visualize fleet-level processing velocity and workload pressure so teams can react before latency spikes.
Trust
Designed for teams that need observability and control without sacrificing governance, access boundaries, or auditability.
Choose the path that fits your team: start in the hosted product, install the native desktop app, or move into the docs for self-hosting and operational guidance.
Built by engineers who wanted a more trustworthy BullMQ operations surface, with a desktop footprint that is easy to install and simple to standardize.
Everything you need to know about Durabull. Can't find what you're looking for? Email us.
Durabull is a modern, powerful dashboard for managing BullMQ queues. It provides real-time monitoring, job debugging, worker tracking, and team collaboration features — all in a beautiful, developer-focused interface.